Pipeline reports
abricate
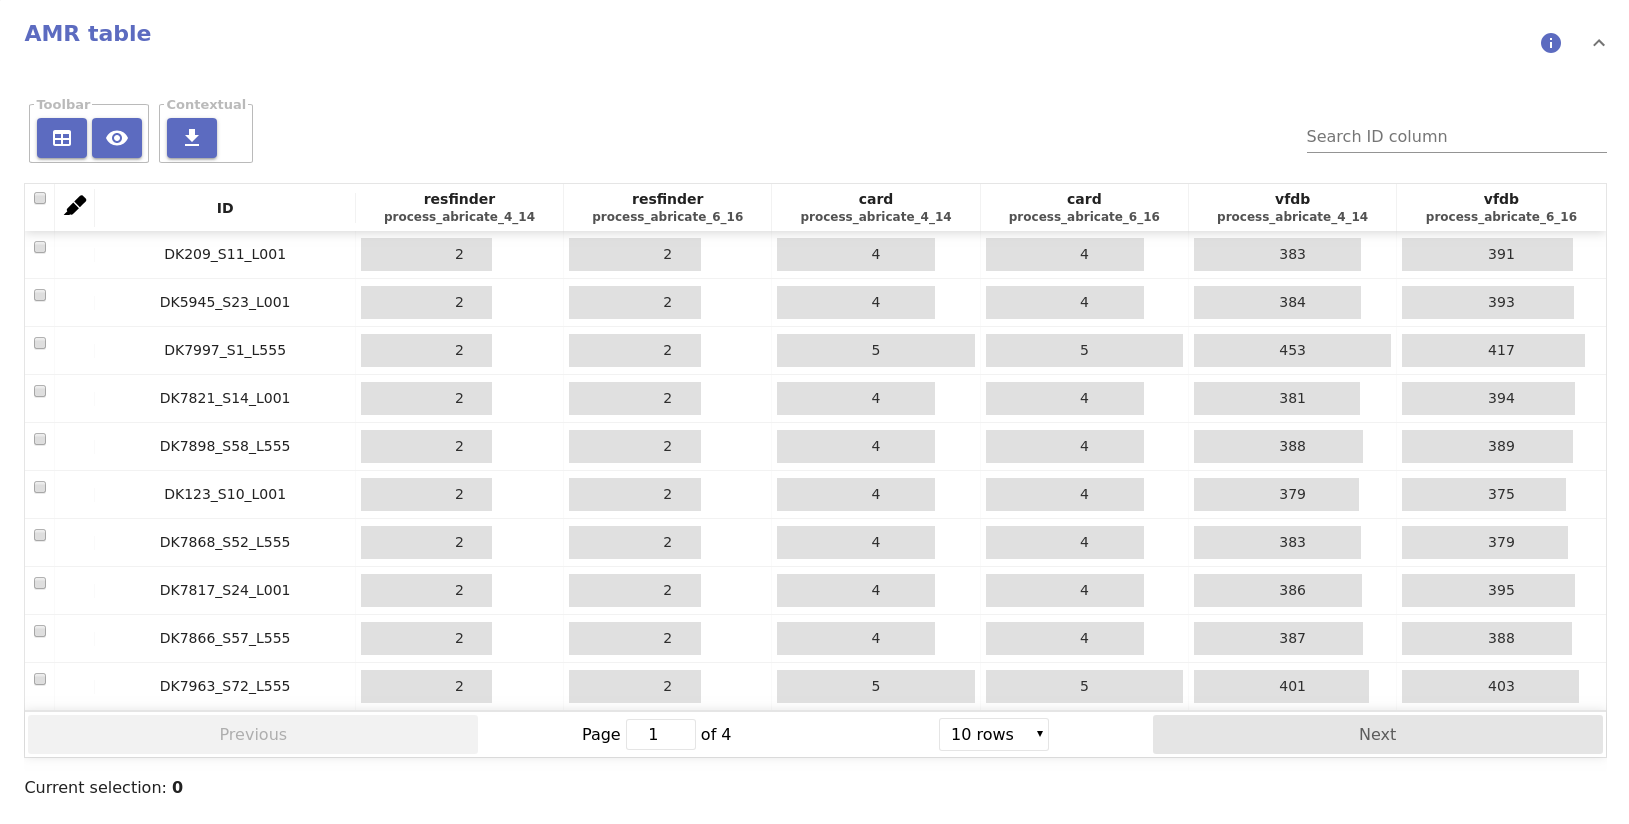
Plot data
- Sliding window AMR annotation: Provides annotation of Abricate hits for
each database along the genome. This report component is only available when
the
piloncomponent was used downstream ofabricate.
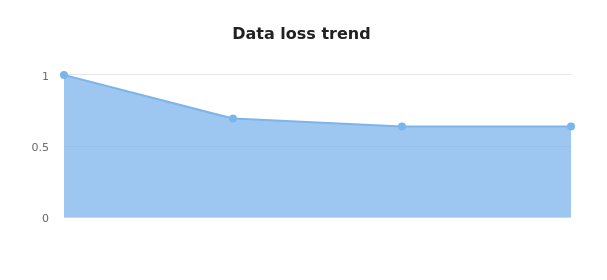
assembly_mapping
Plot data
- Data loss chart: Gives a trend of the data loss (in total number of base pairs) across components that may filter this data.
Warnings
- Assembly table:
- When the number of contigs exceeds the threshold of 100 contigs per 1.5Mb.
Fails
- Assembly table:
- When the assembly size if smaller than 80% or larger than 150% of the expected genome size.
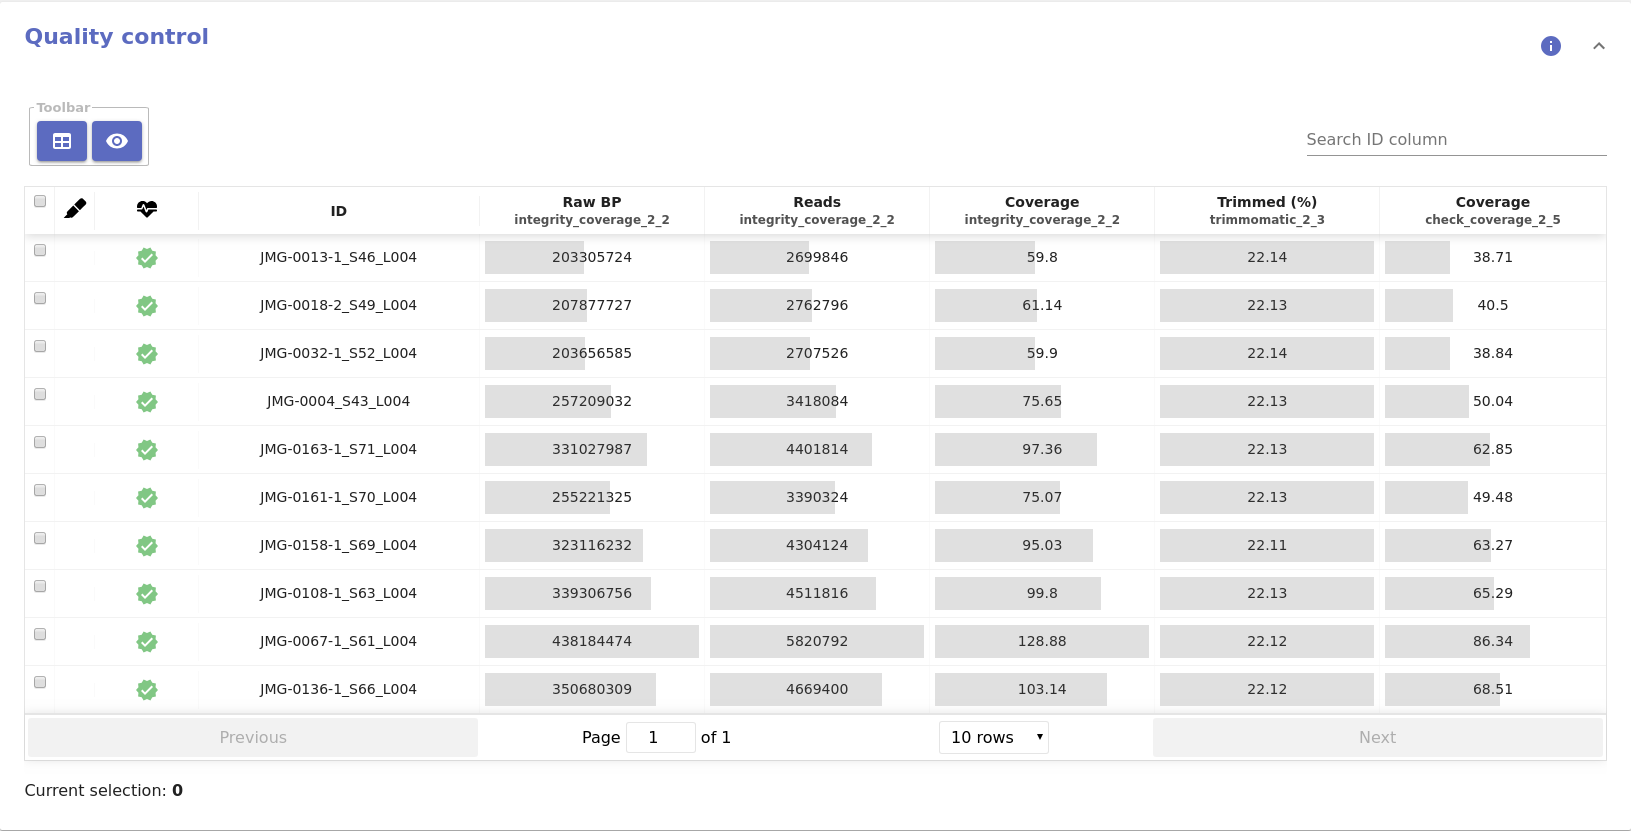
check_coverage
Table data
- Quality control table:
- Coverage: Estimated coverage based on the number of base pairs and the expected genome size.
Warnings
- Quality control table:
- When the enconding and phred score cannot be guessed from the FastQ file(s).
Fails
- Quality control table:
- When the sample has lower estimated coverage than the provided coverage threshold.
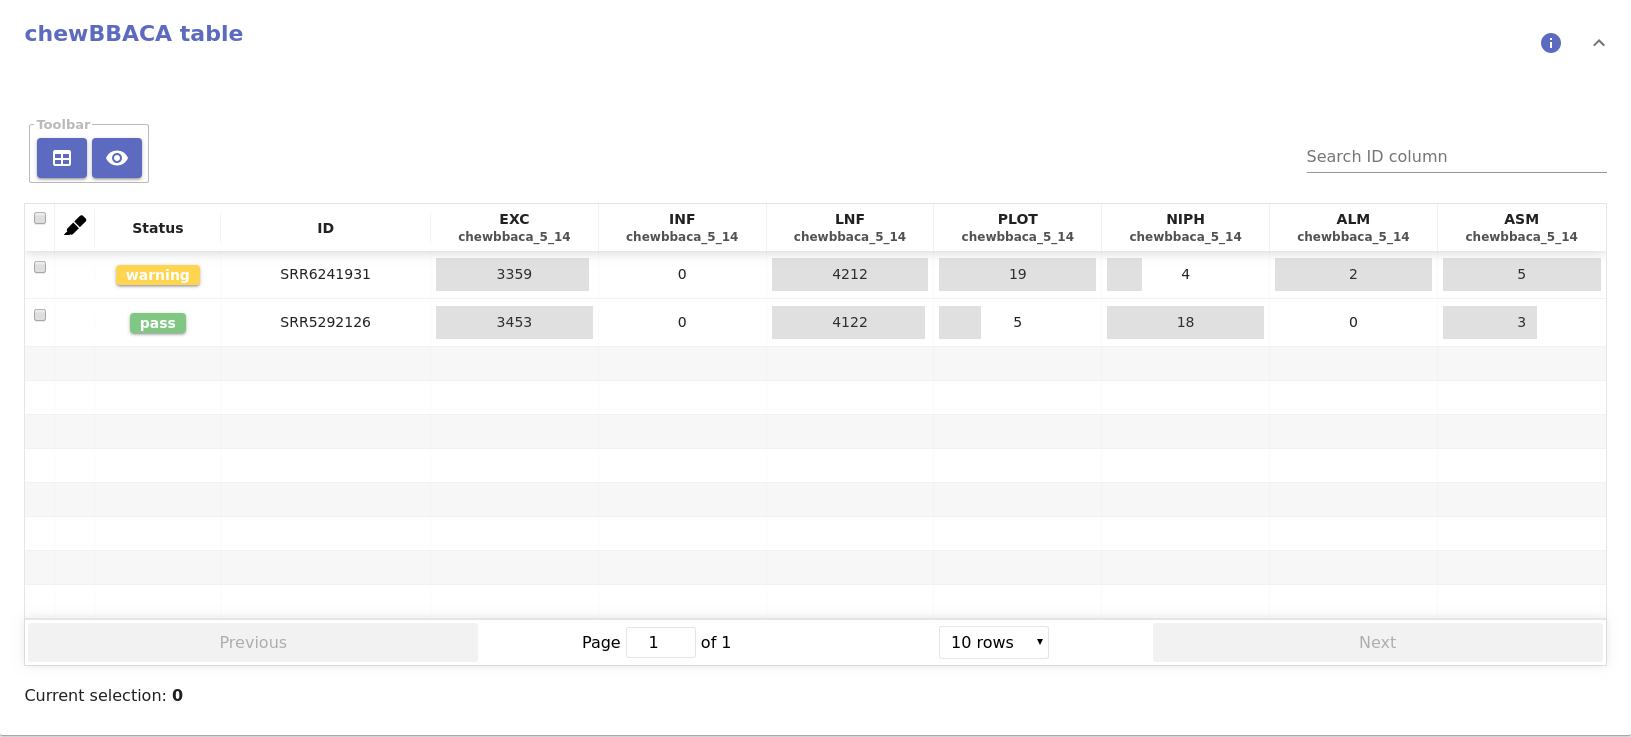
chewbbaca
Table data
- Chewbbaca table:
- Table with the summary statistics of ChewBBACA allele calling, including the number of exact matches, inferred loci, loci not found, etc.
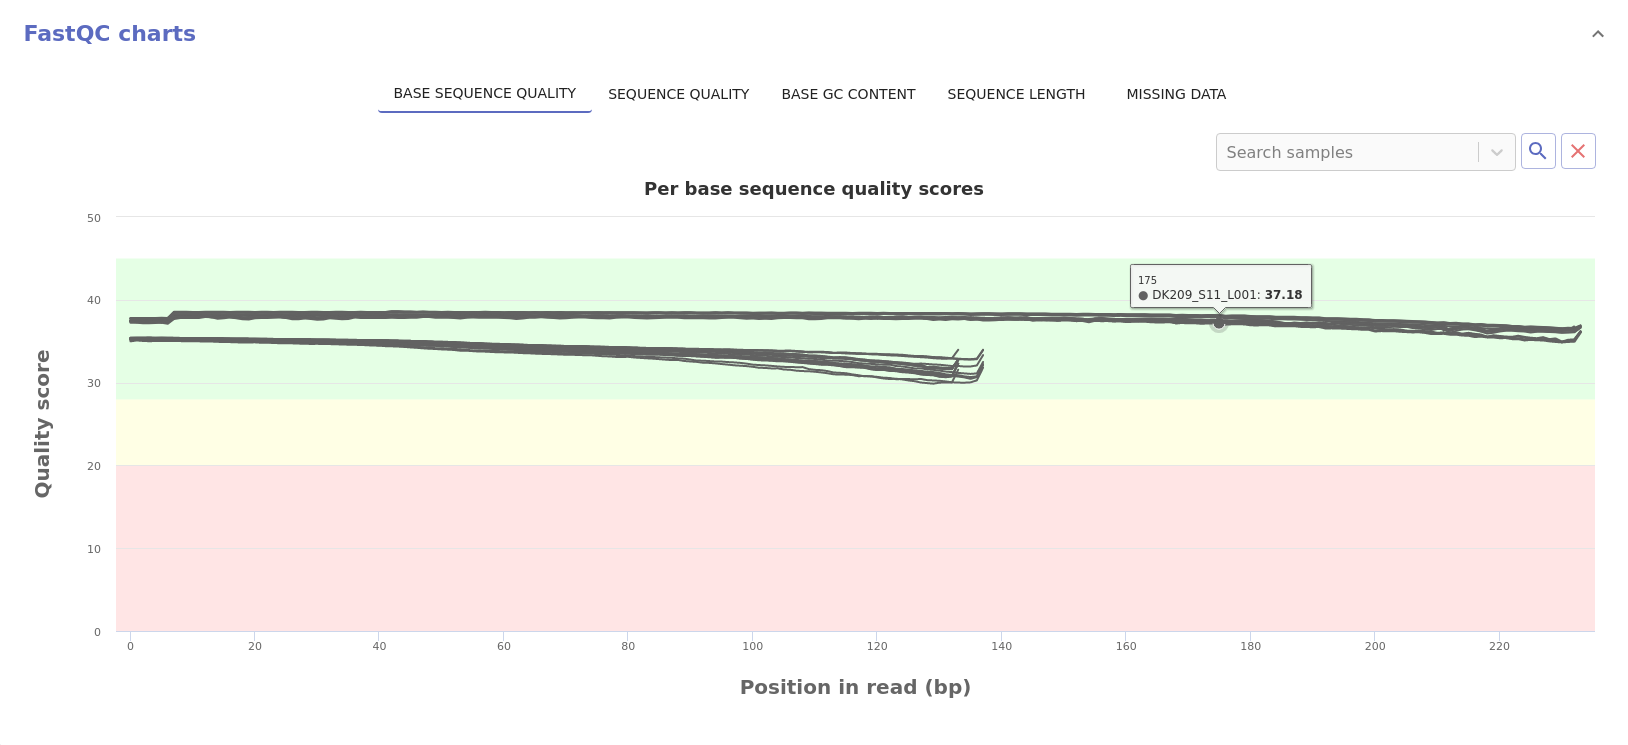
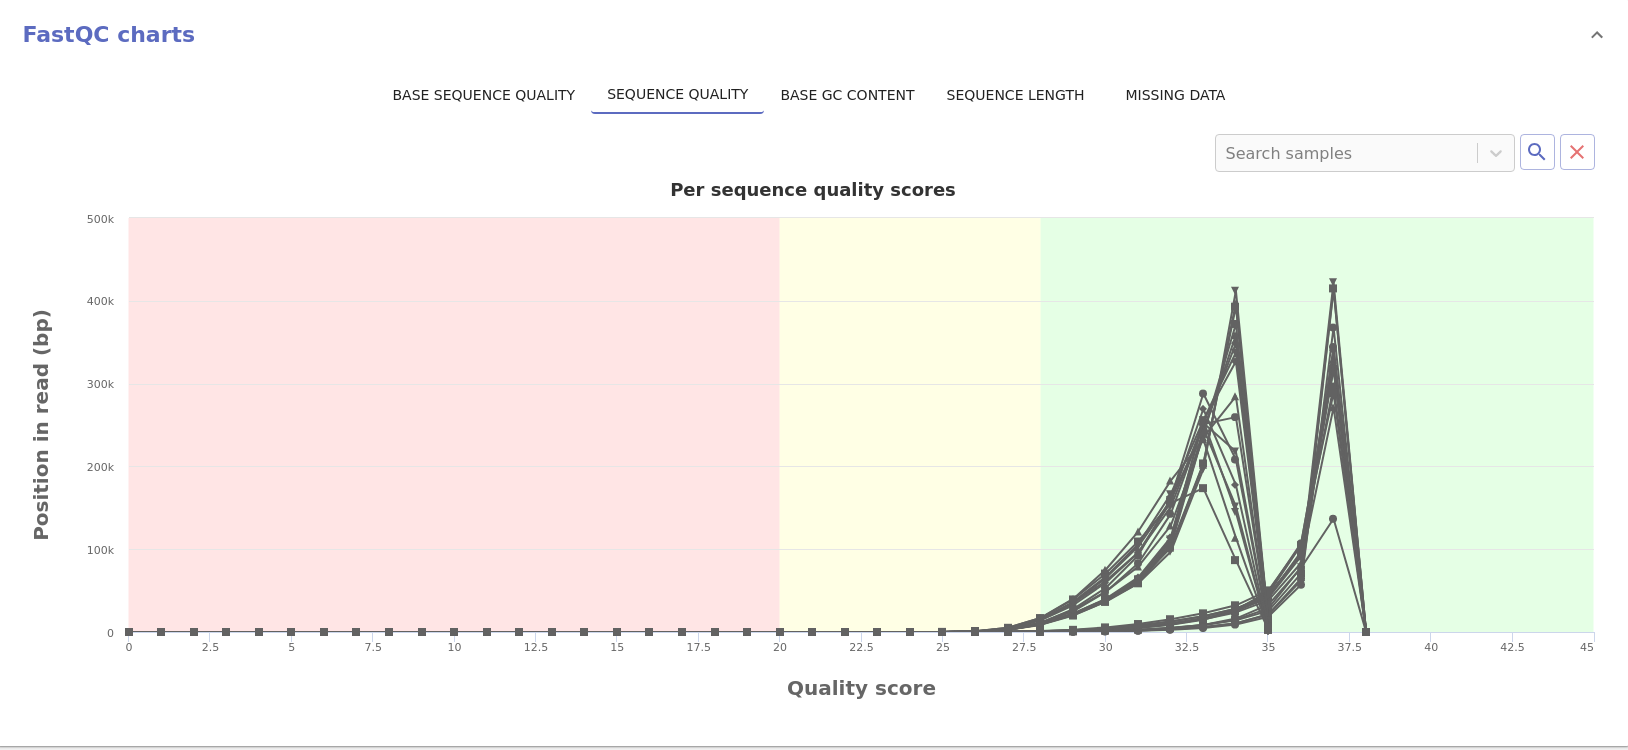
fastqc
Plot data
- Base sequence quality: The average quality score across the read length.
- Sequence quality: Distribution of the mean sequence quality score.
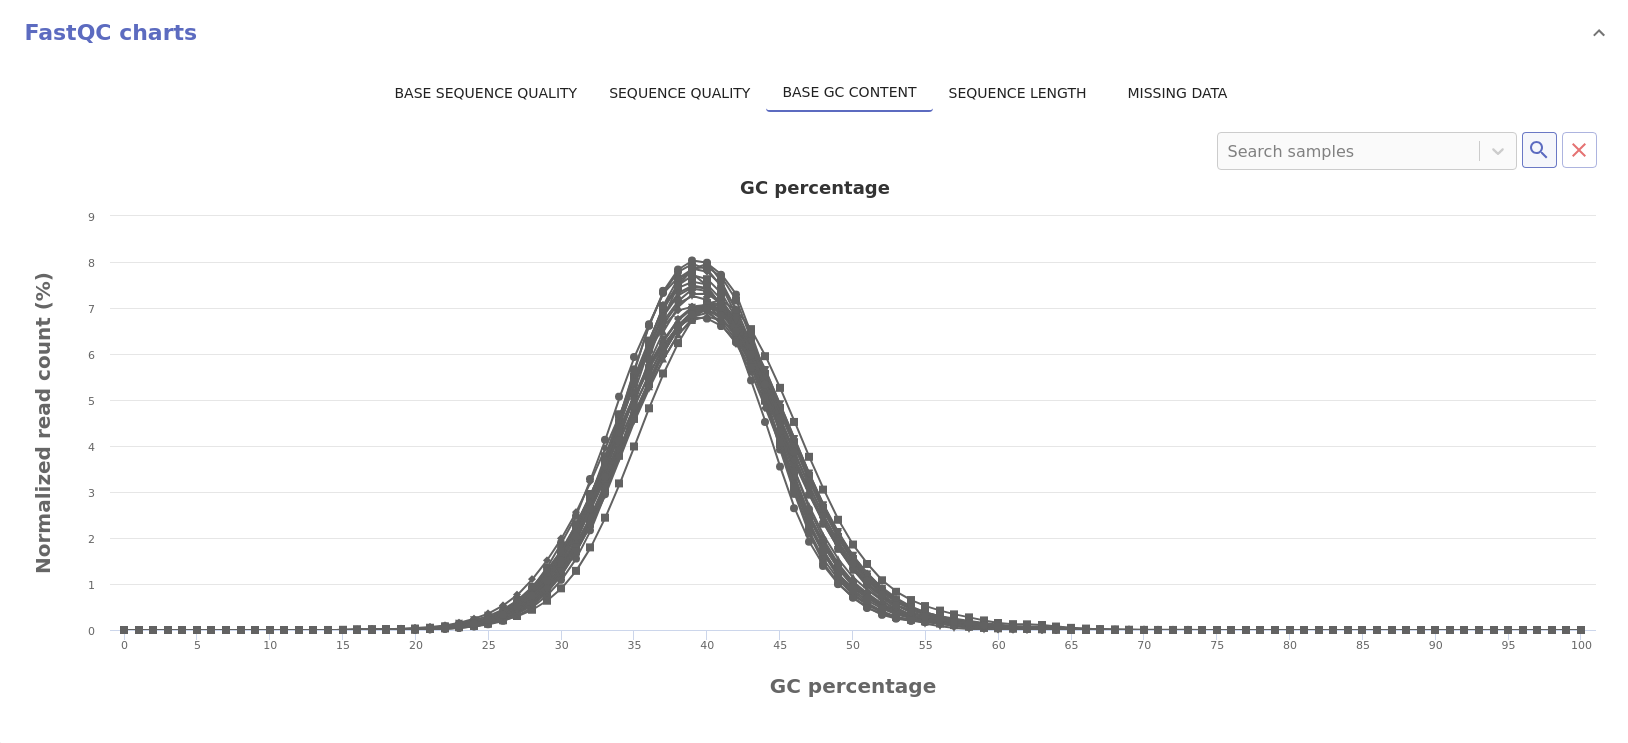
- Base GC content: Distribution of the GC content of each sequence.
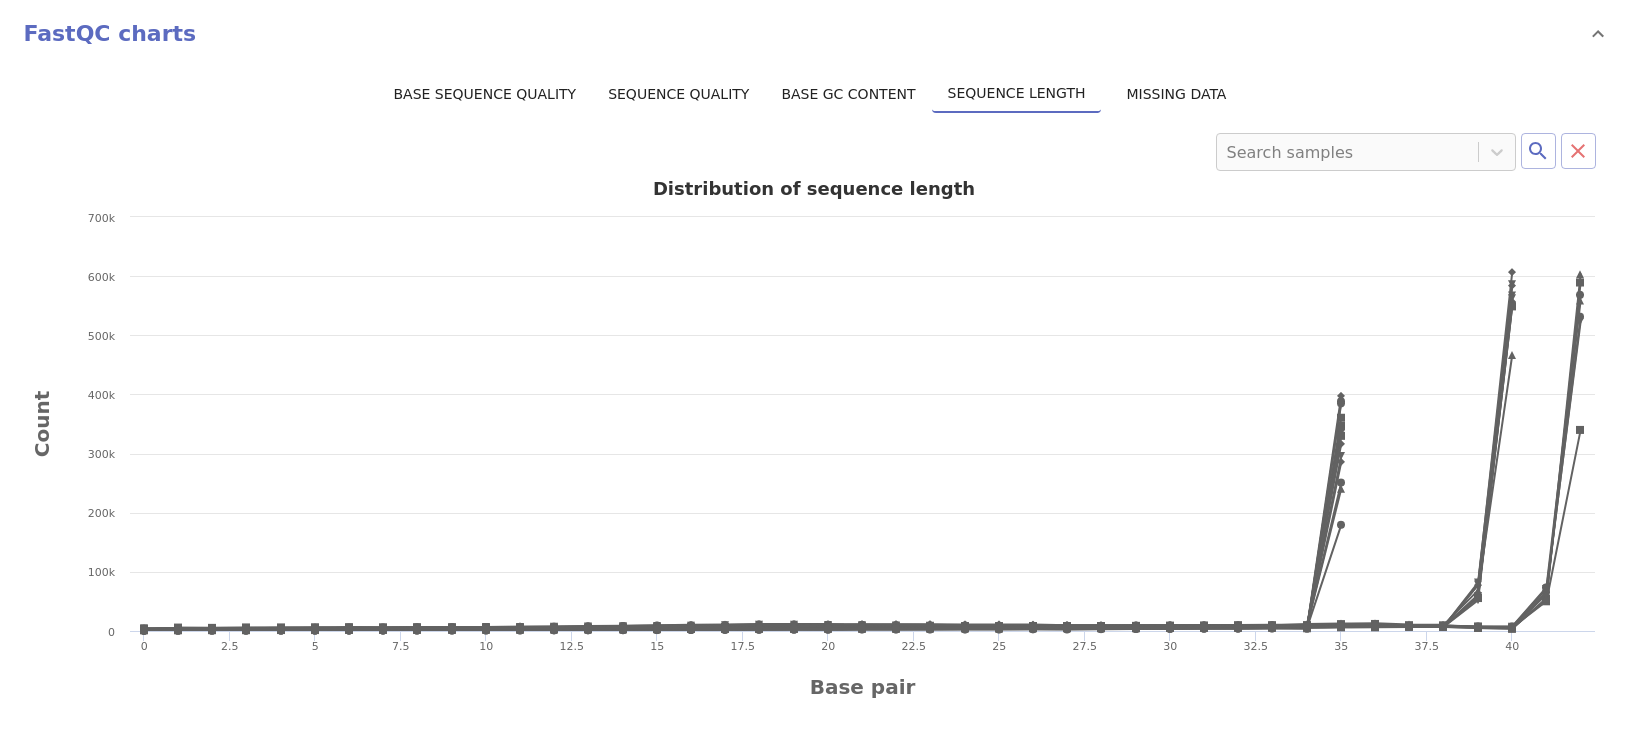
- Sequence length: Distribution of the read sequence length.
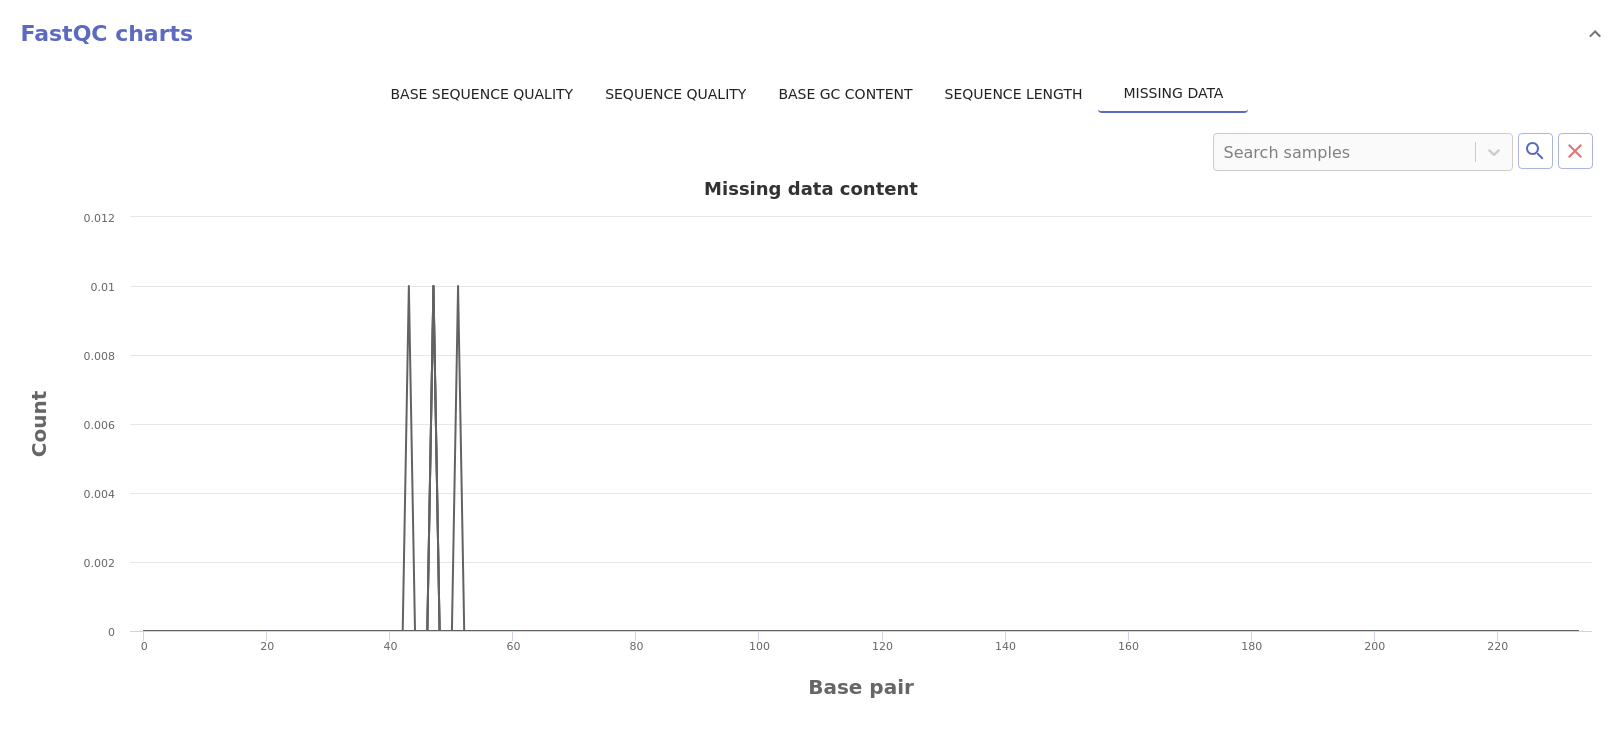
- Missing data: Normalized count of missing data across the read length.
Warnings
- The following FastQC categories will issue a warning when they have a
WARNflag: - Per base sequence quality.
- Overrepresented sequences.
- The following FastQC categories will issue a warning when do not have a
PASSflag: - Per base sequence content.
Fails
- The following FastQC categories will issue a fail when they have a
FAILflag: - Per base sequence quality.
- Overrepresented sequences.
- Sequence length distribution.
- Per sequence GC content.
- The following FastQC categories will issue a fail when the do not have a
PASSflag: - Per base N content.
- Adapter content.
fastqc_trimmomatic
Plot data
- Data loss chart: Gives a trend of the data loss (in total number of base pairs) across components that may filter this data.
integrity_coverage
Table data
- Quality control table:
- Raw BP: Number of raw base pairs from the FastQ file(s).
- Reads: Number of reads in the FastQ file(s)
- Coverage: Estimated coverage based on the number of base pairs and the expected genome size.
Plot data
- Data loss chart: Gives a trend of the data loss (in total number of base pairs) across components that may filter this data.
Warnings
- Quality control table:
- When the enconding and phred score cannot be guessed from the FastQ file(s).
Fails
- Quality control table:
- When the sample has lower estimated coverage than the provided coverage threshold.
mash_dist
Plot data
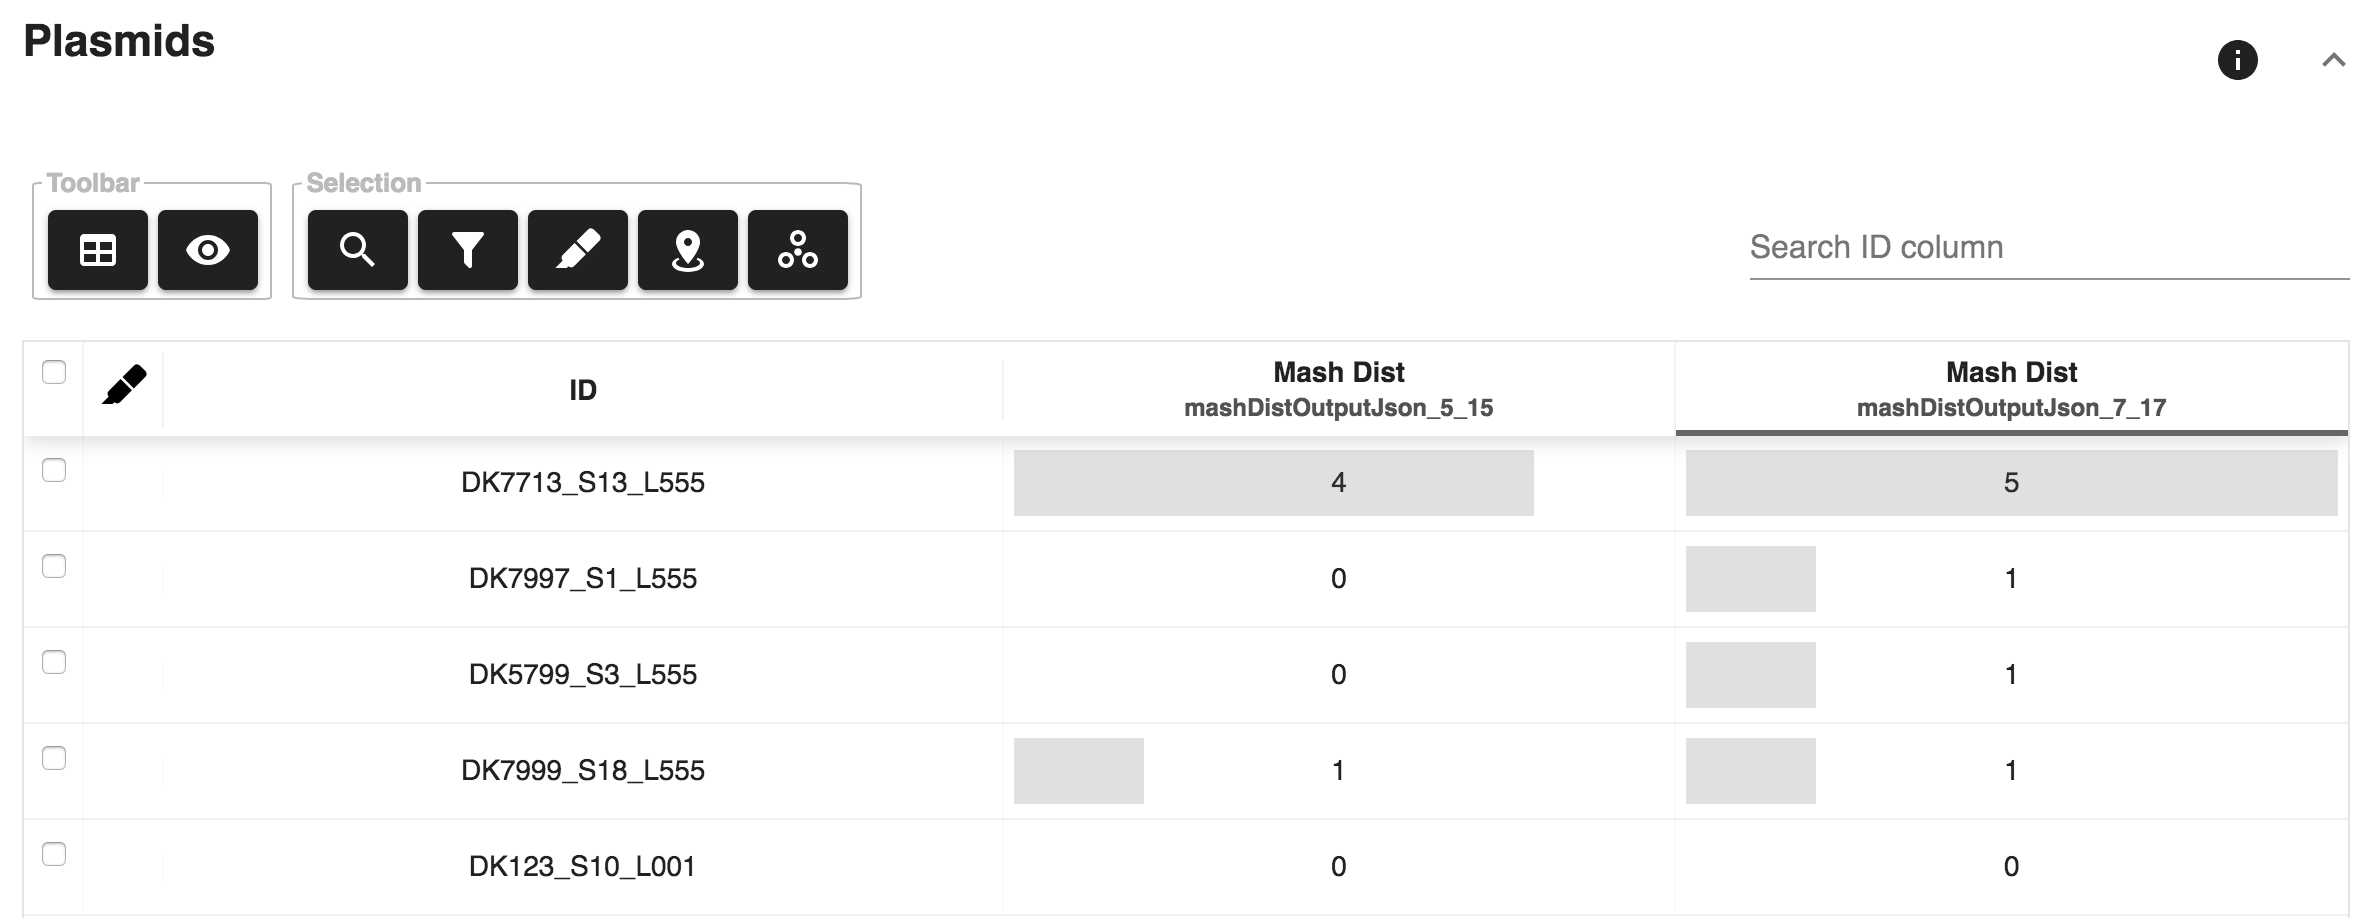
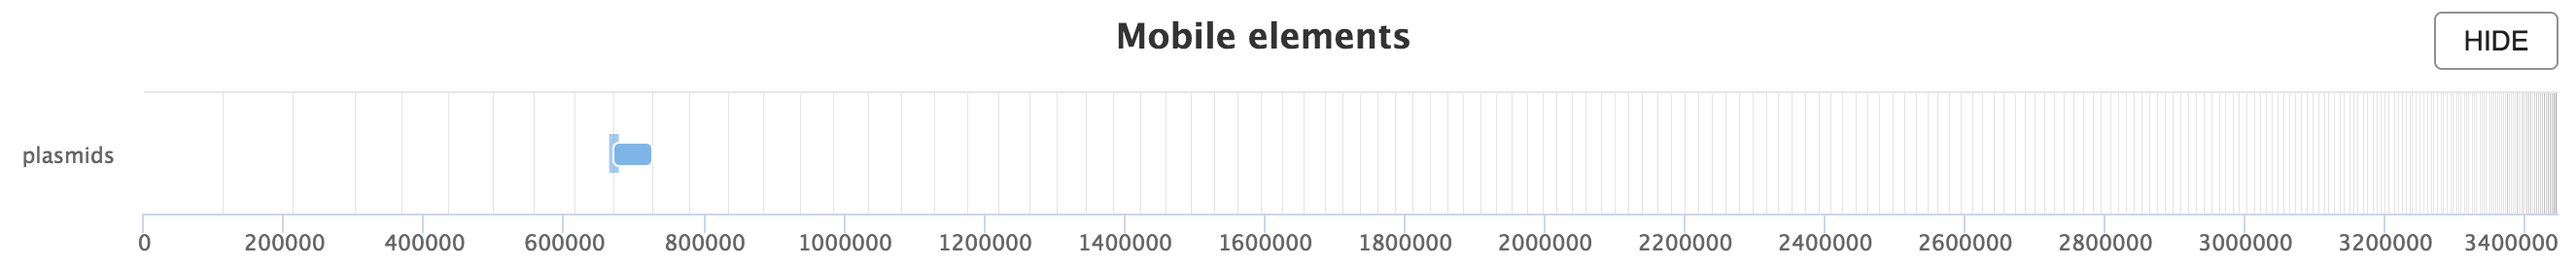
- Sliding window Plasmid annotation: Provides annotation of plasmid
hits along the genome assembly. This report component is only available
when the
mash_distcomponent is used.
mlst
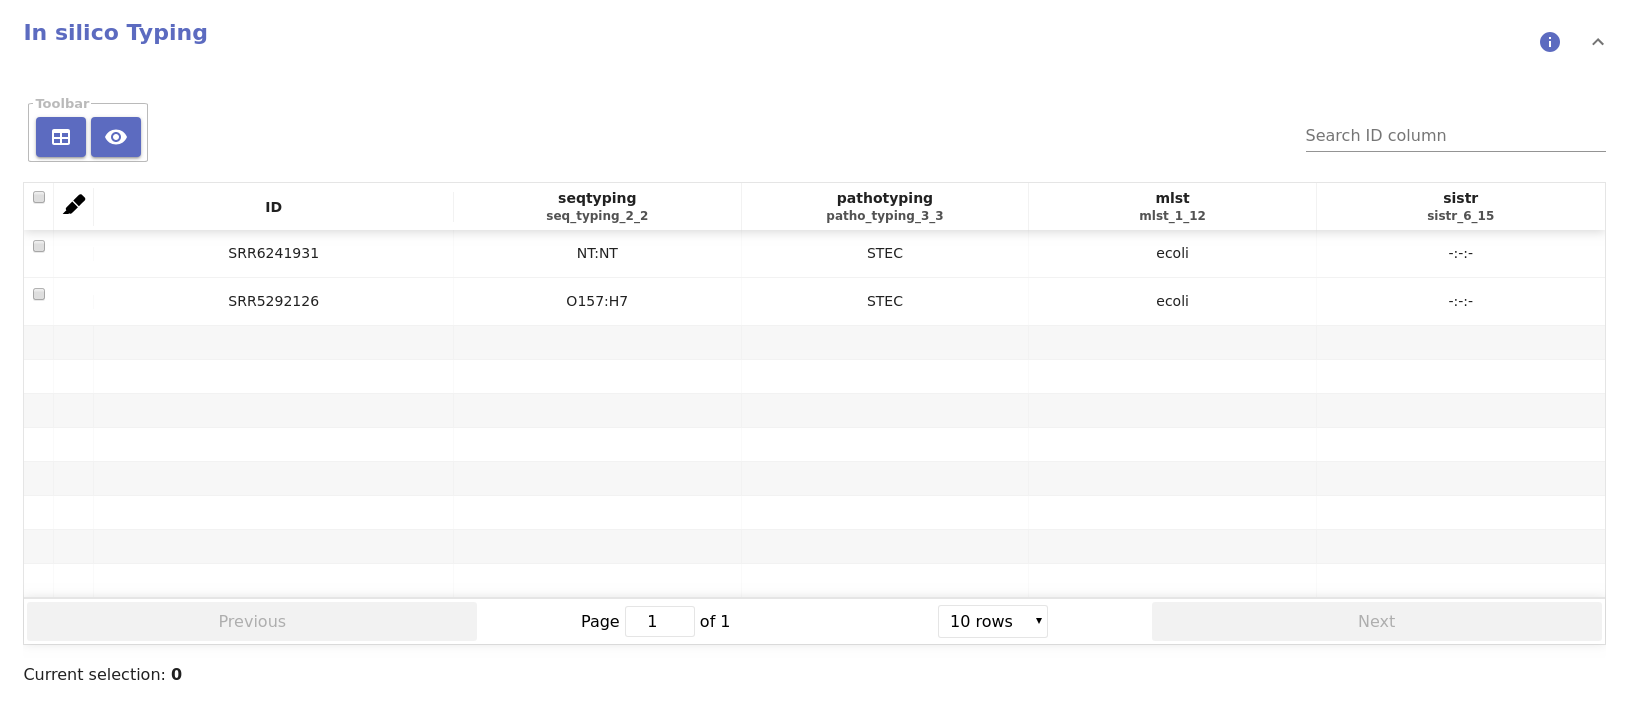
Table data
- Typing table:
- MLST species: The inferred species name.
- MLST ST: The inferred sequence type.
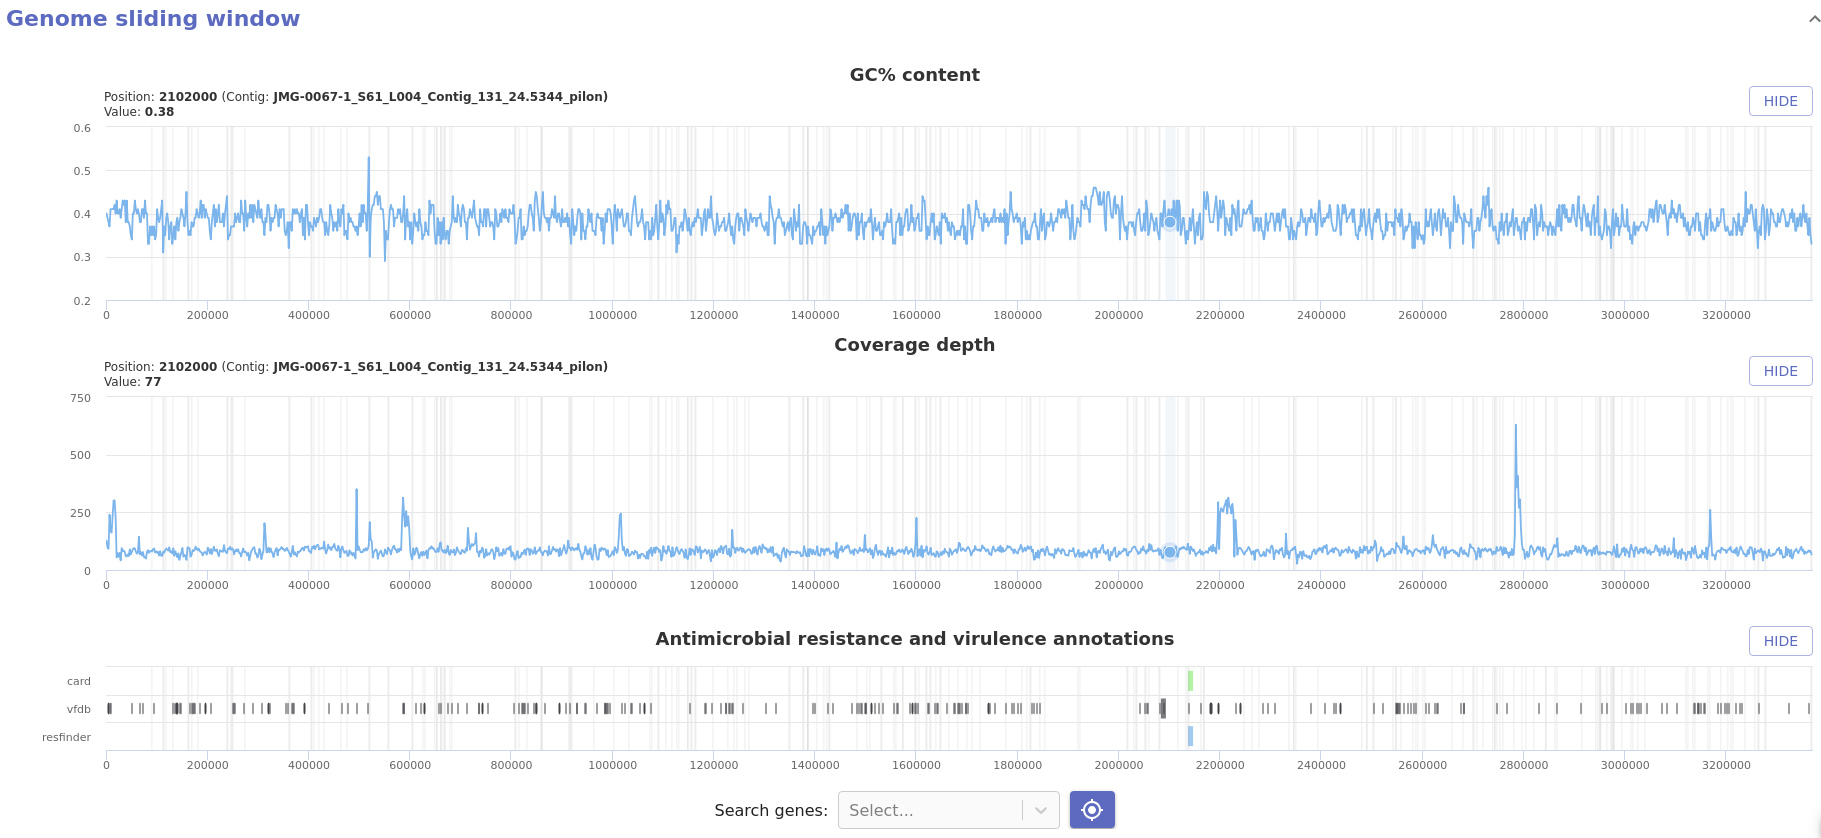
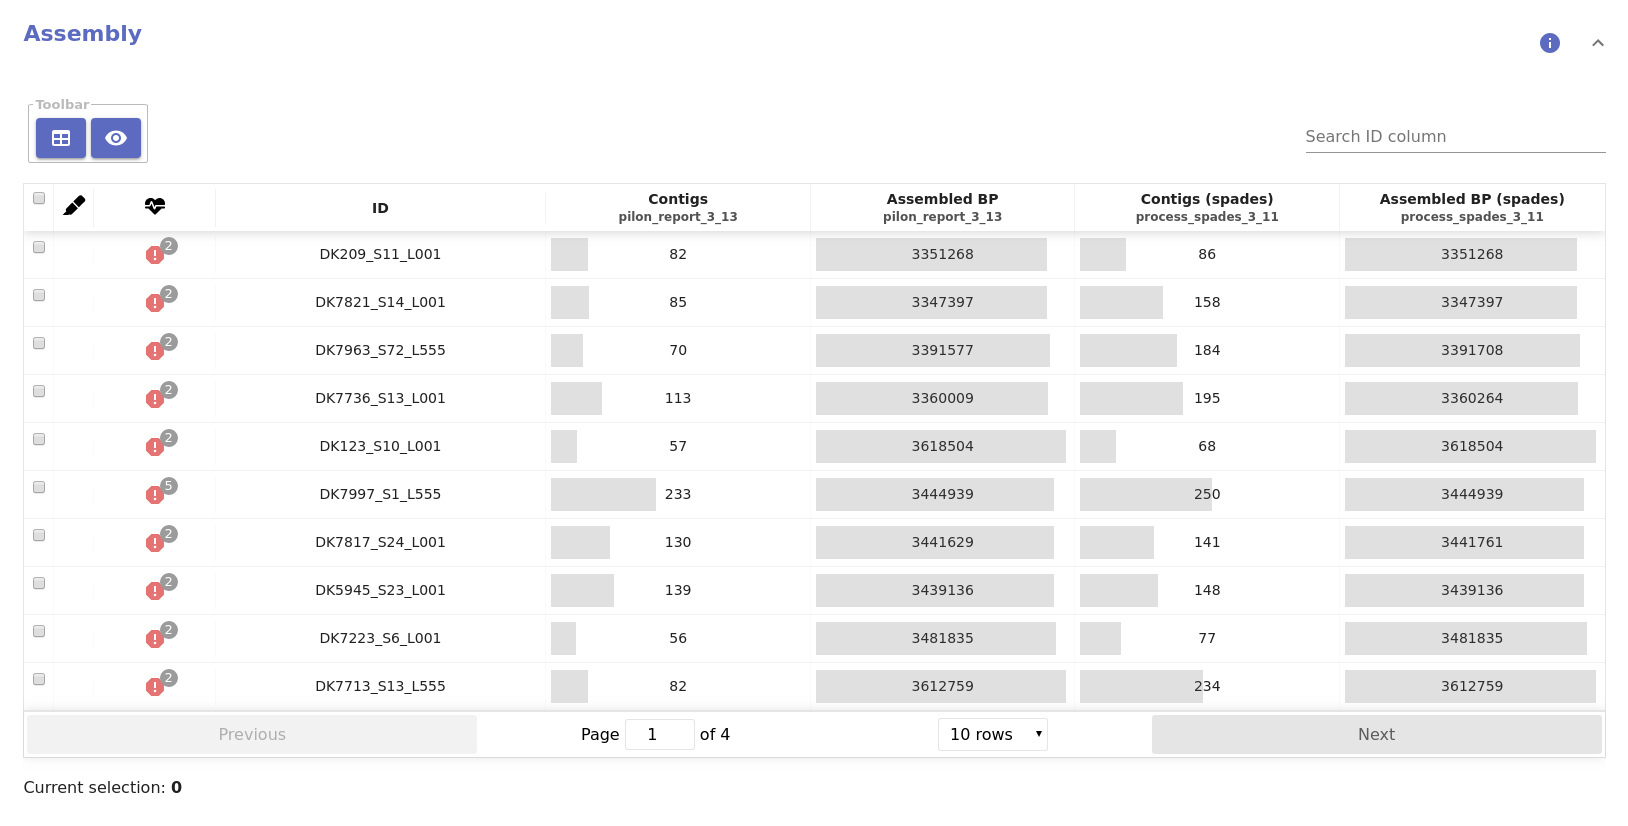
pilon
Table data
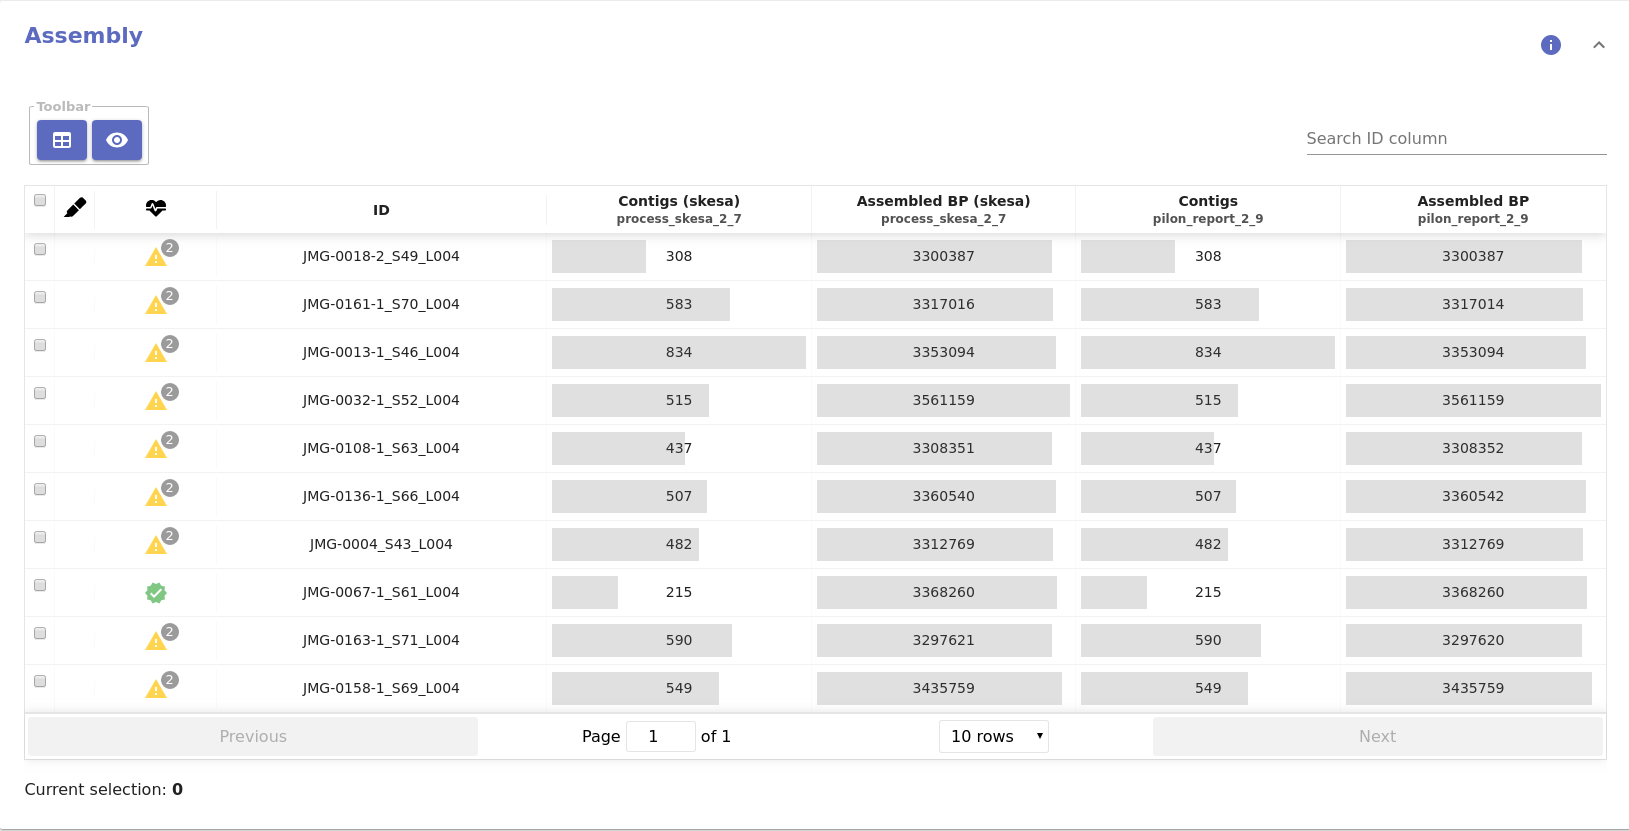
- Quality control table:
- Contigs: Number of assembled contigs.
- Assembled BP: Total number of assembled base pairs.
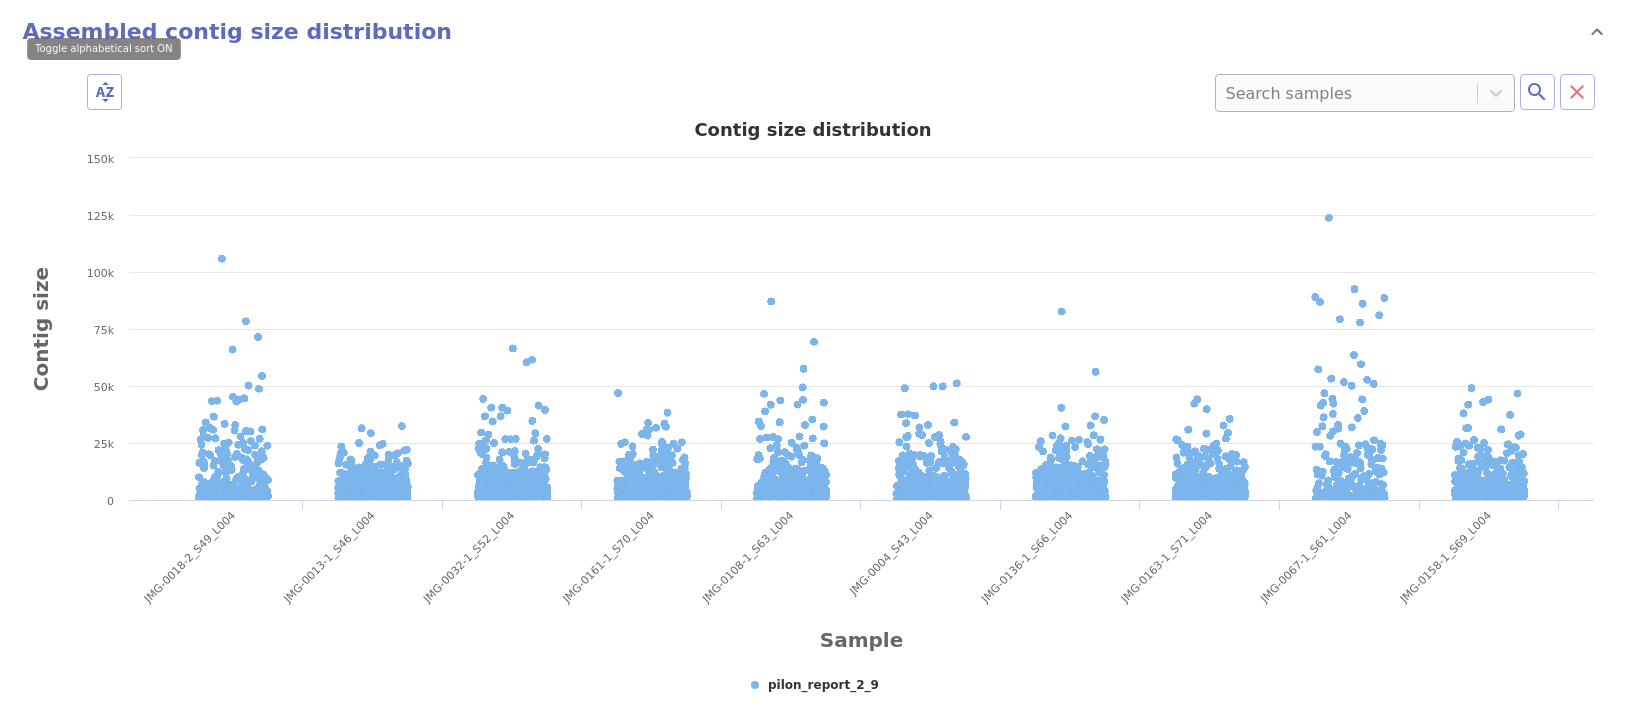
Plot data
- Contig size distribution: Distribution of the size of each assembled contig.
- Sliding window coverage and GC content: Provides coverage and GC content metrics along the genome using a sliding window approach and two synchronised charts.
Warnings
- Quality control table:
- When the enconding and phred score cannot be guessed from the FastQ file(s).
Fails
- Quality control table:
- When the sample has lower estimated coverage than the provided coverage threshold.
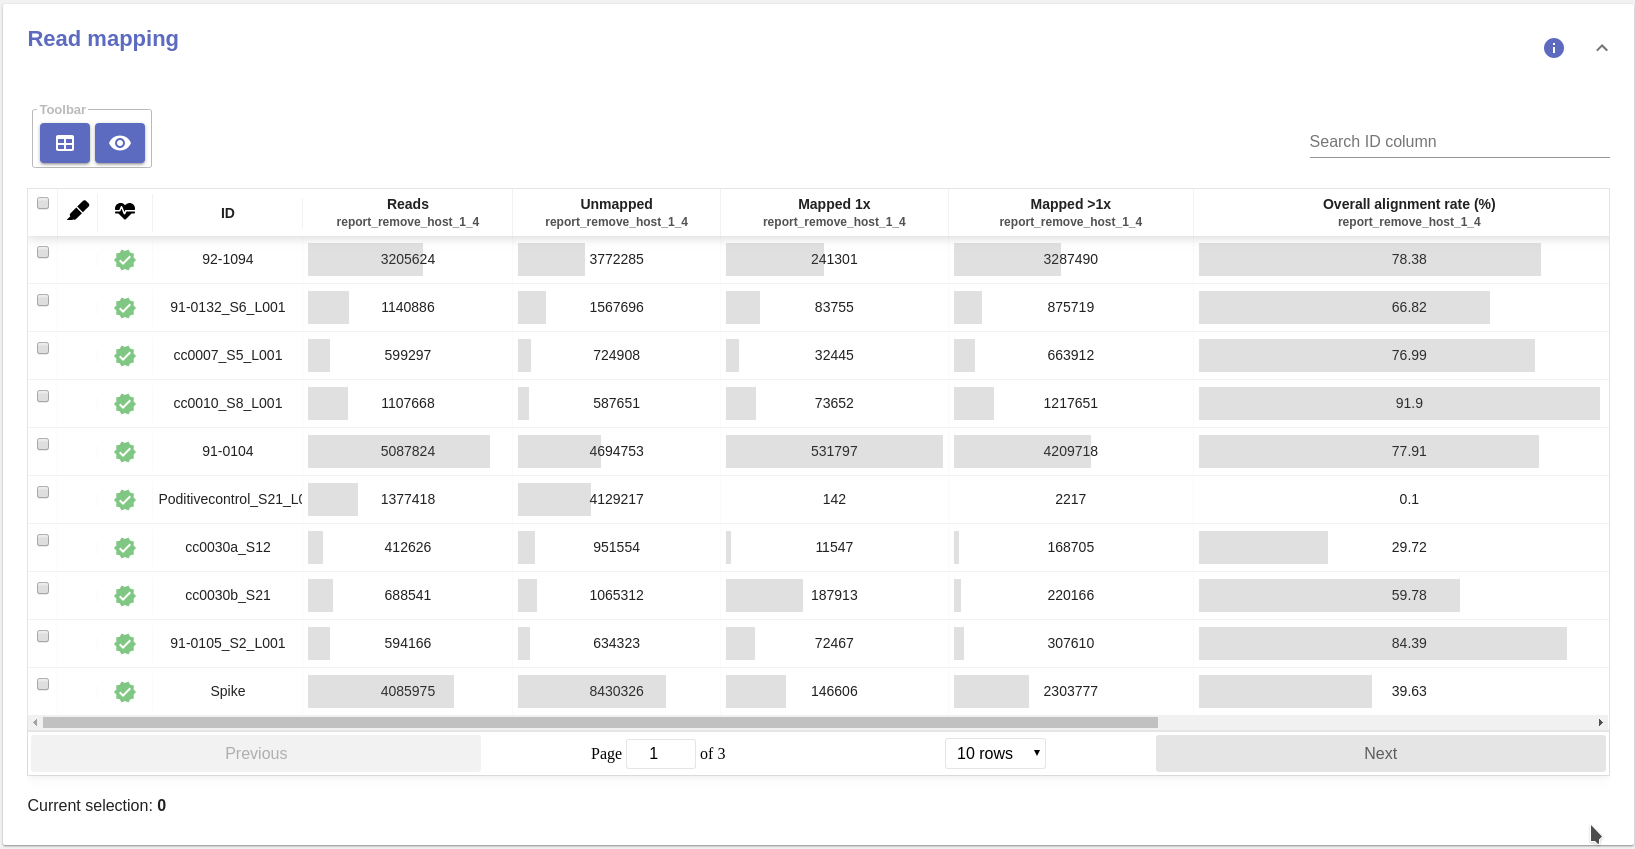
process_mapping
Table data
- Read mapping table:
- Reads: Number reads in the the FastQ file(s).
- Unmapped: Number of unmapped reads
- Mapped 1x: Number of reads that aligned, concordantly and discordantly, exactly 1 time
- Mapped >1x: Number of reads that aligned, concordantly or disconrdantly, more than 1 times
- Overall alignment rate (%): Overall alignment rate
process_skesa
Table data
- Quality control table:
- Contigs (skesa): Number of assembled contigs.
- Assembled BP: Total number of assembled base pairs.
Warnings
- Assembly table:
- When the number of contigs exceeds the threshold of 100 contigs per 1.5Mb.
Fails
- Assembly table:
- When the assembly size if smaller than 80% or larger than 150% of the expected genome size.
process_spades
Table data
- Quality control table:
- Contigs (spades): Number of assembled contigs.
- Assembled BP: Total number of assembled base pairs.
Warnings
- Assembly table:
- When the number of contigs exceeds the threshold of 100 contigs per 1.5Mb.
Fails
- Assembly table:
- When the assembly size if smaller than 80% or larger than 150% of the expected genome size.
process_viral_assembly
Table data
- Quality control table:
- Contigs (SPAdes): Number of assembled contigs.
- Assembled BP (SPAdes): Total number of assembled base pairs.
- ORFs: Number of complete ORFs in the assembly.
- Contigs (MEGAHIT): Number of assembled contigs.
- Assembled BP (MEGAHIT): Total number of assembled base pairs.
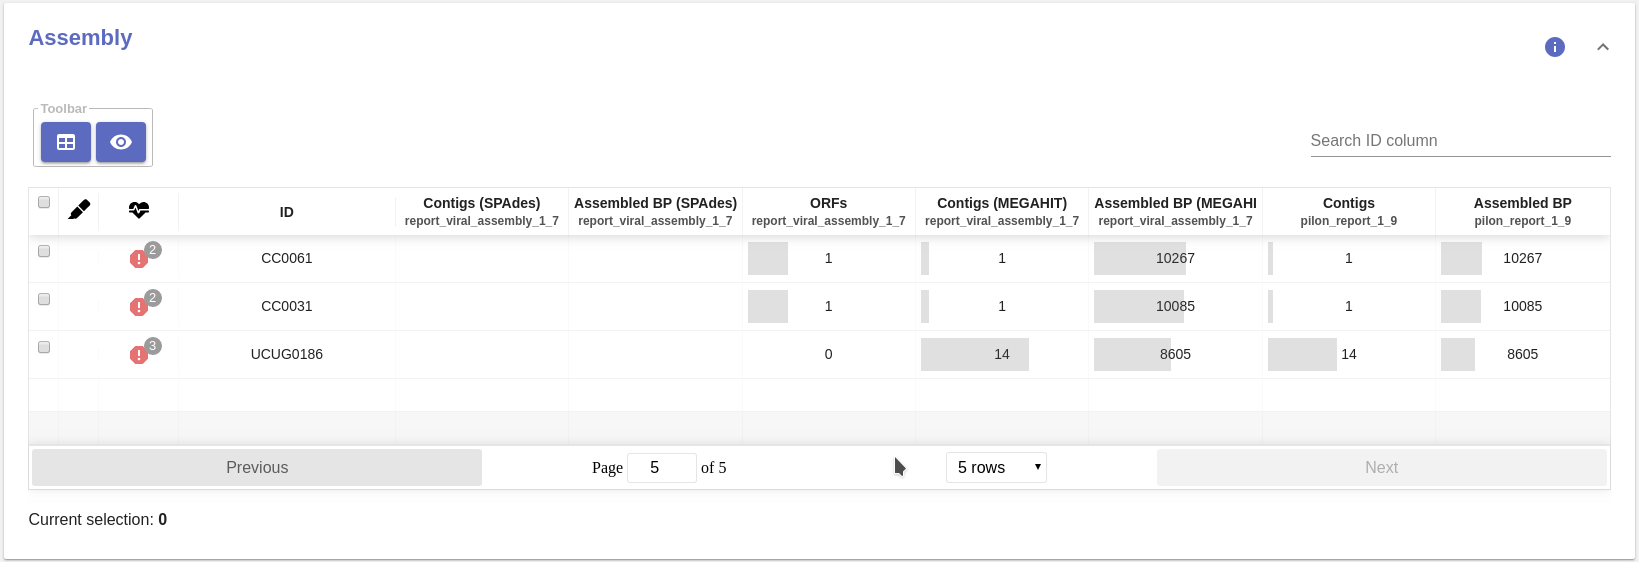
Fails
- Assembly table:
- When the assembly size if smaller than 80% or larger than 150% of the expected genome size.